Some things are so much easier on land. At volcanoes above sealevel you can pick up a Global Positioning System (GPS) receiver and some tiltmeters and hike up the mountain to measure the ways a volcano deforms as molten rock moves into a magma chamber or up to the surface. Our chief scientist, Bill Chadwick, started his career as a volcanologist at Mt. St. Helens measuring volcano deformation.
View this animation of Axial's inflation and deflation during an eruption:
Learn more about volcano inflation and deflation at Mount St. Helens Learning Center site:
http://www.mshslc.org/activity/volcano-deformation/
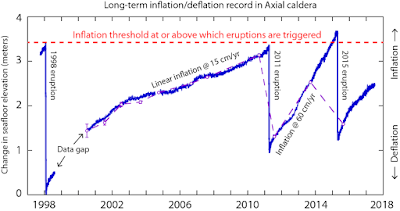
But on submarine volcanoes, these same kinds of measurements are much more challenging. For the last 3 days we have been utilizing the ROV Jason to collect pressure measurements at benchmarks on the seafloor within the summit caldera at Axial Volcano and at the reference point to the south. The goal of the pressure measurements and Sentry multibeam re-surveys is to measure how much the seafloor is moving up or down, and thereby increase our understanding of how magma moves in and out the plumbing system beneath the surface of Axial volcano. We know that Axial has erupted 3 times in 1998, 2011 and 2015, and after each eruption the surface above the magma chamber of the volcano deflated like a balloon as the magma erupted onto the seafloor. The deflation during the 1998 eruption amounted to 3.5 meters (11.5 feet!) and was documented with two Bottom Pressure Recorder (BPR) instruments.
 |
| Pressure measurements documenting inflation and deflation with each eruption at Axial. |
Since that time, Bill Chadwick and Scott Nooner have been adding measurement sites, different types of pressure measuring instruments and finding new ways to measure the volcanic deformation in collaboration with colleagues at the Monterey Bay Aquarium Research Institute (MBARI). The more data we have about the deformation of the volcano, both in space and time, helps them model what is going on beneath the seafloor and how and where magma is stored, and how the supply to the volcano changes with time.
Watch this fly-through of Axial Seamount from the south to the north. Benchmarks are black symbols and the vents are white. 10x's vertical exaggeration of bathymetry. (animation by Susan Merle):
Why and how to measure pressure?
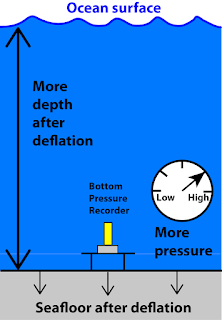
On the seafloor we can’t take out a GPS recorder and get our elevation from the Global Positioning System (it doesn’t work underwater). One way to precisely measure the elevation of the seafloor is to measure the pressure at the bottom due to the height of water between the seafloor and the ocean surface. If the seafloor moves upward, the height of the water above it is decreased and so the pressure measured at the bottom goes down. The opposite is true if the seafloor moves downward. The pressure sensors can detect vertical movements as small as a centimeter or better (2.5 inches)!
 |
| Scott Nooner removing mini BPR's recovered by Jason. |
Three benchmarks (that do not have mini BPR’s) are near bottom pressure recorders and tiltmeters that are part of the Ocean Observatory Initiative’s Cabled Array. These instruments are wired to an undersea cable and collect pressure data continuously.
You can see this real time pressure data live at NOAA EOI's site:
https://www.pmel.noaa.gov/eoi/rsn/index.html
You can download and plot the data yourself at the OOI site:
http://oceanobservatories.org/instrument-series/botpta/

| 
|
OOI depictions of the cable array from Oregon to Axial Seamount.
Axial volcano has been re-inflating (re-filling with magma) since the last eruption in 2015. The level of the ground rising at each benchmark is different and taken as a whole these varied levels give us a picture of the depth and shape of the magma chamber and the movement of magma in the volcanic system. The challenge is that we need to have all the measurements in some way tied to a standard, so we can compare them. Each continuously recording BPR has a level of drift of the measurements separate from the other BPR’s. To correct for this drift, we do this long three to four day survey, where we have the Jason ROV take a single Mobile Pressure Recorder (MPR) around to each of our benchmarks to tie all the separate measuring devices together. This process results in much more accurate measures of the uplift of the volcano surface over time as it re-inflates before the next eruption. Ultimately, these measurements also enable us to forecast the timing of the next eruption, see NOAA EOI's site: https://www.pmel.noaa.gov/eoi/axial_blog.html
Watch this video of the mobile pressure sensor (MPR) being deployed on benchmark:
It’s still a bit early to tell, but it looks like the next eruption at Axial Volcano is still at least several years away.


